| SIMULATED DEPTH TO WATER TABLE |
| The model also predicts the seasonal changes of the water table depth. The simulated depths to water table in both seasons (wet and dry season) over the 20 year period are given in table. The model tends to maintain almost the same depths for each season throughout the simulation period. Obviously the seasonal fluctuation indicated lower depth during the wet (first) season whereby the water table rises close to the surface and deeper during the dry (second) season. However, drastic change of decrease in depth is noticeable just from year zero (entry depth) to the first year which is a common tendency of the model, after which the same trend as explained is maintained. During the whole simulation period none of the predicted depths recedes to the same level or deeper depth than the initial entry depth. |
| GP |
YEAR_0 |
YEAR_3 |
YEAR_10 |
YEAR_20 |
| Season |
1 |
1 |
2 |
1 |
2 |
1 |
2 |
| Pe111 |
-4.18 |
-1.39 |
-1.83 |
-0.85 |
-1.38 |
-0.85 |
-1.38 |
| Pe112 |
-2.15 |
-1.05 |
-1.33 |
-1.10 |
-1.38 |
-1.19 |
-1.48 |
| Pe113 |
-3.46 |
-0.96 |
-1.45 |
-0.81 |
-1.28 |
-0.84 |
-1.26 |
| Pe114 |
-3.19 |
-0.87 |
-1.64 |
-0.83 |
-1.22 |
-1.20 |
-1.22 |
| Pe115 |
-2.52 |
-0.64 |
-1.08 |
-0.64 |
-1.07 |
-0.64 |
-1.07 |
| Pe211 |
-2.89 |
-0.84 |
-2.11 |
-0.80 |
-2.08 |
-0.81 |
-1.68 |
| Pe311 |
-2.61 |
-0.80 |
-1.26 |
-0.76 |
-1.20 |
-0.76 |
-1.20 |
| Pe412 |
-3.01 |
-0.83 |
-1.23 |
-0.75 |
-1.18 |
-0.75 |
-1.18 |
| Pe413 |
-2.30 |
-0.83 |
-1.40 |
-0.82 |
-1.40 |
-0.82 |
-1.49 |
| Pe511 |
-3.03 |
-0.82 |
-1.21 |
-0.71 |
-1.16 |
-0.71 |
-1.16 |
| Va111 |
-1.79 |
-0.81 |
-1.28 |
-0.77 |
-2.19 |
-0.73 |
-1.23 |
| Va211 |
-2.50 |
-0.78 |
-1.31 |
-0.76 |
-1.54 |
-1.44 |
-1.69 |
| Va311 |
-2.40 |
-0.66 |
-1.13 |
-0.65 |
-1.12 |
-0.65 |
-1.12 |
|
| * for GP see Geo-pedological map |
|
| Figure 1 : Estimated water depth for point 36 (S1=season 1, S2 = season 2) |
|
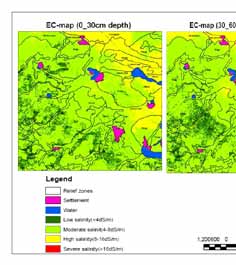
| The rising groundwater table depth during the first season can be attributed to water percolation due to high torrential rainfall received during this season. While the lowering the water-table depth in the dry season is associated with less rainfall and high evaporation and evapotranspiration rates. The consequence of this kind of cycle between wet and dry season result in capillary rise and salt mobilization to the soil surface which harms crop growth, affect the ecosystems and damage water quality |
|
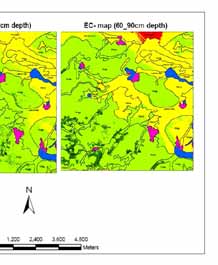
| Figure 2 : Map showing salinity (EC) distribution the relief zones for the soil depth |
|