| RUNOFF RATE FOR DIFFERENT LAND COVER TYPES |
To study the effect of land cover on the amount of surface runoff, 18 homogenous samples areas for land cover were selected, and the total amount of runoff from these mini-catchments was modeled based on rainfall 060905 event.
|
| The model results show significant differences in predictions of average surface runoff rates for the different land cover types. The average surface runoff rate estimated for the whole areawas 7.16 m3/s. The weighted average surface runoff rates estimated per pixel for different land cover types are shown. The highest volume of surface runoff was predicated for maize cultivations with an average value of 482x10-3 m3/s and the lowest was predicted for forest areas with an average of 13.3x10⁻³ m3/s. On the whole, agricultural areas includes cornfield, mixedcrop and orchard showed approximately 16 times higher values of surface runoff rates with an average of 440x10-3 m3/s and non-agricultural includes forest, degradedforest and grass areas having an average surface runoff value of 27.87 x10⁻³ m3/s. |
| Land Cover Types |
Average Surface Runoff (m3/s) |
| Sub-catchment 1 |
Sub-catchment 2 |
Sub-catchment 3 |
| Forest |
39.74 x 10⁻³ |
0.13 x 10⁻³ |
0.04 x 10⁻³ |
| DegradeForest |
0.02 x 10⁻³ |
63.88 x 10⁻³ |
11.49 x 10⁻³ |
| Grass |
20.80 x 10⁻³ |
52.00 x 10⁻³ |
62.73 x 10⁻³ |
| Cornfield |
507.8 x 10⁻³ |
463.3 x 10⁻³ |
475 x 10-3 |
| MixedCrop |
486.80 x 10⁻³ |
118.92 x 10⁻³ |
718.50 x 10⁻³ |
| Orchard |
639.6 x 10⁻³ |
333.50 x 10⁻³ |
216.62 x 10⁻³ |
|
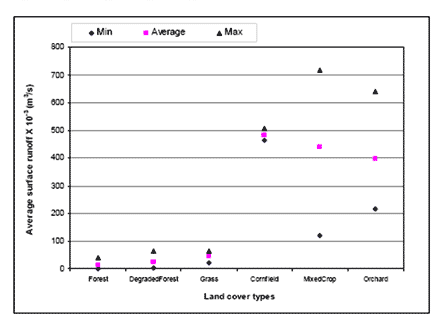 |
| Figure 1 : Weighted average surface runoff on different land cover types. |
|
| |
| The spatial and temporal distribution of surface runoff as predicted by the calibrated model is presented. The rainfall data of 060905 event, the peak of rainfall intensity was start at the first hour of the rainfall event. No runoff was estimated in the first few time steps in permeable areas, because much of the rain water was lost due to interception, infiltration and surface storage. After the initial losses were satisfied, the excess precipitation was routed over the catchment as surface runoff. The peak runoff at the outlet was observed in three hours (time step 180) after the peak rainfall occurred. In the fourth hour, the volume of surface runoff gradually declined because the rainfall intensity had significantly reduced. Although the rainfall intensity had decreased at the second hour, runoff still continued to occur because of the accumulation of rainwater from preceding time steps and because of the travel time for the water to move downstream as is calculated by the kinematic wave equation. |
|
|
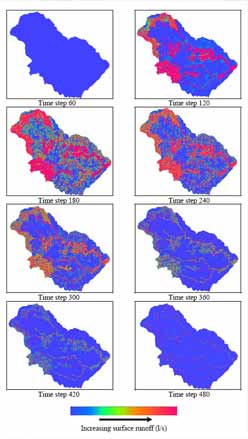 |
| Figure 2 : Spatial and temporal distribution of surface runoff (time step=1 min). |
|
|


