| LANDSLIDE MODELING AND SUSCEPTIBILITY MAPPING |
| The main objective is to assess the various landslide conditioning factors and then use them to predict the future occurrence of landslides in the area. A variety of new tools are available for use in GIS for evaluating the distribution of phenomena in a statistical framework. Weights of Evidence is one such tool which was initially applied in GIS to predict the occurrence of minerals based on known mineral deposits but has been expanded to the study of landslides. Weights are estimated for a set of evidential themes associated with the known occurrences.These weights are then evaluated for the evidential themes in an area to produce a map of potential values for occurrence of that mineral or hazard. This chapter describes the application of the weights of evidence method for predicting the occurrence of landslides in Ang Khang district, Northern Thailand. |
| Modelling Landslides |
| Modelling of the landslides is a factor analysis process. A factor analysis process is a step-by-step approach used to prepare landslide hazard zones of an area (Carrara 1983; Carrara 1988). There are four steps that are followed to complete the factor analysis and produce a hazard map: (1) map the existing landslides and combine the factor maps one by one (Geology, slope gradient, Aspect, Soil subgroup, texture, depth, the hydrologic factors, etc ) into individual map units; (2) overlay the landslide inventory on the combined factor map; (3) prepare a combined factor analysis for all combinations of the factors and group combinations of these factors in a way that defines the three levels of landslide hazard; and (4) produce a map with landslide hazard zones from the grouped combinations. The software used to produce both the evidence maps and the factor maps
was ILWIS version 3.3. |
| Landslide Inventory maps |
| According to (Carrara, Cardinalli et al. 1991), landslide inventory maps are the most important input data for predicting future landslide occurrence and susceptibility mapping since they contain the spatial attributes of the landslides. They also contain other attributes like state of activity, type and subtype of the landslides. The location of these landslides can give an idea of the factors which may cause future landslides. |
| Two landslide maps were produced for Ang Khang using interpretation of aerial photos taken in January 2002 (Figure 1) and field observations in the period between September and October 2005 (Figure 2). The landslide maps were for the years 2002 and 2005. Both maps were produced by making use of on screen digitizing and Epipolar stereo pairs generated in ILWIS. The Landslide inventory from aerial photos of 2002 was used as the evidence map in the modelling and generation of weights for the different factors while the landslide map of the field observations of 2005 was used to test how well the model performed. The main types of landslides identified in Ang Khang were rotational slides (Slumps). |
 |
 |
| Figure 1 : Landslides mapped through aerial photo interpretation (2002) |
Figure 2 : Landslides mapped in the field 2005 |
|
| Landslide Causal and Conditioning Factors |
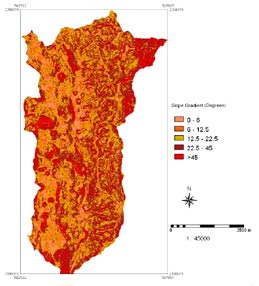
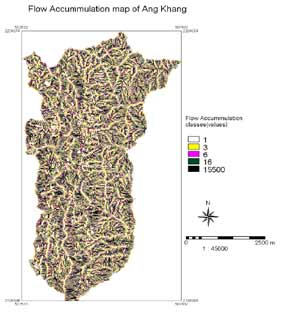
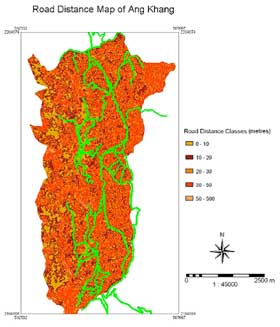
| Landslides are complex geological and/or geomorphological processes caused by a large number of factors which makes the classification of existing landslides and prediction of their future occurrence also fairly complex. (Carrara and Merenda 1976; Carrara and Guzzetti 1995) noted that the first important step in a GIS- supported landslide susceptibility assessment is to gather existing data related to the occurrence of landslides. The factors selected for this study, based on field observations, include Geology (Lithology), Slope gradient, Aspect, Land use/Land cover, Flow accumulation, Soil Depth, Texture class, and soil classification at Sub group level, and Distance from Roads. |
 |
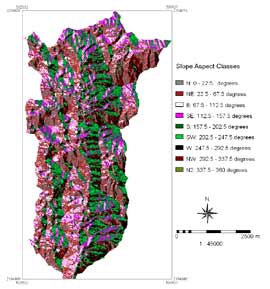 |
| Figure 3 : Slope gradient map of Ang Khang |
Figure 4 : Slope Aspect map |
|
 |
 |
| Figure 5 : Soil – subgroup map |
Figure 6 : Soil texture map |
|
 |
 |
| Figure 7 : Soil Depth map |
Figure 8 : Flow accumulation map |
|
 |
 |
| Figure 9 : Geology map |
Figure 10 : Landcover map |
|
 |
|
| Figure 11 : Road Distance map |
|
|
| |
| References |
 Carrara, A., M. Cardinalli, et al. (1991). "GIS techniques and statistical models in evaluating landslide hazard." Earth Surface Processes and landforms 16(5): 427 – 445. Carrara, A., M. Cardinalli, et al. (1991). "GIS techniques and statistical models in evaluating landslide hazard." Earth Surface Processes and landforms 16(5): 427 – 445. |
| Carrara, A. and L. Merenda (1976). "Landslide inventory in northern Calabria, southern Italy." Geological Society of America Bulletin 87(8): 1153-1162. |
| Carrara, A. and F. Guzzetti, Eds. (1995). Geographical Information Systems in Assessing Natural Hazards:Advances in Natural and Technological hazards Research. Dordrecht, Kluwer Academic Publishers. |
|


