| GIS AND RS BASED PREDICTIVE SOIL MAPPING |
| Since a few decades, also in Thailand, like many other countries, land has become scarce. This made people rush into the sloping areas; clearing extensive surfaces from the original cover (often bush-land or forest) to cultivate, mainly with annuals. It has become a cliche', hearing, and reading in articles, that population increase has resulted into a huge demand for sloping areas, often classified as �marginal lands�. Usually, these areas have not been appropriately surveyed for soils. Even in a country like Thailand where many soil maps are made and neatly compiled in albums (for different provinces), when going for the mountainous/ hilly areas polygons (soil map units) are much bigger than in the flat valley bottoms. The legend won�t give much information, just reading, for instance, association of soils 1 and 2, that is, soils of slope complex. The reason to this is that a few decades ago, when soil survey was carried out, nobody thought that there will be once demand for the soils of sloping areas, usually covered by dense vegetation. |
|
 |
|
| However, now that many areas have been brought under agricultural use, the lack of soil data is felt. Land use planning has become a common exercise. Deforestation on sloping areas and intensive cultivation of field crop or fruit trees down-slope without any conservation measure has revealed to be the major cause of soil erosion and/or mass movement. |
| Obviously soil erosion badly impacts the soil quality, agricultural productivity, and ecological diversity. Furthermore, it reduces the capacity of rivers and drainage ways which leads to the occurrence of floods and blocking irrigation canals. Soil erosion is a detrimental process both on-site and off-site. Erosion not only reduces soil depth, it also removes the topsoil, meaning that the most fertile part of the soil is truncated, lack of organic matter leads to sealing and crust- forming, disturbing root penetration, diminishing the capacity of soils to hold water (WHC). The final result is, indeed, reduction in crop yields. Moreover, water erosion also creates off site environmental problems, such as water pollution, siltation of reservoirs and degradation of coastal ecosystems, etc. |
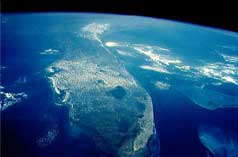
| For Thailand, the total amount of land under cultivation has increased from about 11 million hectares in 1961 to 29 million hectares in 2000, which is almost double, while, the forest area has deceased from about 27.3 million hectares in 1961 to 18.3 million hectares in 2000. The larger part of the 18 million hectares of new land under cultivation comes from the forest area which has been found in the sloping land mainly mountainous areas. These sloping lands occur predominately in the northern part of the country and account for about 30% of the total land area and highly susceptible to erosion. Soil erosion continues to be one of the main problems in the northern region. It is very important to be able to assess erosion hazard for planning and implementation. Data from soil surveying is very useful to reach erosion prone area. Land Development Department (LDD) finished soil survey of the country at scale of 1: 100,000, already in the 70�s. Many reports including soil map albums give sample information on the soils of the valley bottoms, and gently sloping piedmonts, normally under cultivation; mainly rice in the valley terraces, and orchards and annual crops on the piedmonts. Although Soil Taxonomy has been used to classify soils, the �Soil Series�, appearing on the maps (indicated by numbers) are not the soil series, as defined by the USDA. However, soil surveyors have a clear picture of different soil series, which can be quite useful for use in small scale land use planning studies. The problem is that, for instance, in the northern region soil survey has been done in the level and sloping areas of less than 35%. The remainder, covering more than 70% of the total area is not covered and is still without any soil information. That is exactly here, where large areas are being used for annual rainfed cropping and the increasingly more and more intensive cultivation, and that has led to serious erosion and mass wasting. |
 |
|
The question on how to obtain soil data in a short time, and at the same time, in an inexpensive way has become important? To do soil survey in a conventional way is very costly. Considering these points, the research topics (at MSc level) were decided upon:
1. How to map soils on sloping, inaccessible, areas using remote sensing data in a GIS environment (�predictive mapping�), and
2. How, and what to use to assess erosion prone areas and/or the vulnerable areas for mass wasting, applying geopedologic approach supported by digital terrain models and the derivatives, and their interpretation for understanding the soil vulnerability. |
|
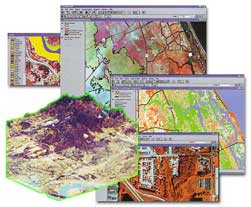
In inaccessible areas, the geopedologic approach to soil survey helps modeling soillandscape relationships, which gives way to the determination of spatial distribution of soils. Transects are laid, crossing through representative map units, resulted from image (aerial photograph and/or Landsat data overlaid on the digital terrain model, constructed for the study area) interpretation. A geopedologic map is a soil map, which contains much facts and understanding around the landscape, represented.
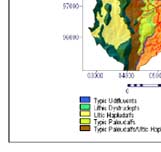
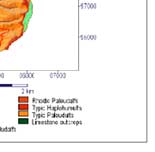
A number of mini-pits as the representative sites (in the image-interpretation map units) together with the required environmental factors, stated in the Jenny equation (cl, o, r, p, t) are studied. Soils are classified according to the USDA Soil Taxonomy System. The obtained knowledge (on soils and their environment) from the transects are put into a number of decision trees and/or as input layer in an artificial neural network (ANN), the output of which are the soils in any unsampled area (in a map unit). Validation is done to check the accuracy. In the two case studies (Moonjun, 2007; Udomsri, 2006) the overall accuracy is relatively high, about 80 %. (Figure 1 and 2).
To prepare the soil erosion hazard map and/or mass wasting vulnerability, the required data is extracted from the prepared geopedologic map in combination with the other required parameters such as slope steepness, stream power index (SPI), mean curvature (concave or convex landform) and present land use. |
| Setting up a soil database is very much needed to organise soil data collected in soil surveys. A conceptual soil database for land degradation assessment is developed by (Prueksapong, 2007). This can be considered starting point in designing and setting up soil database at LDD. |
| In summary, the geopedologic approach demonstrated once again to be quite valuable to predict soils of inaccessible areas. The study shows that the required soil information for multipurpose uses can be made available, even at larger scales than 1:20,000, if sample areas are properly selected and studied. |
|
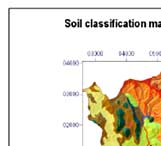
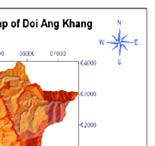
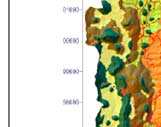
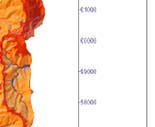
| Figure 1 : Soil classification map of Doi Ang Khang (Udomsri, 2006) |
|
| Figure 2 : Geopedological soil maps derived by applying artificial neural network (left figure) and decision tree model (right figure) (Moonjun, 2007) |
|
|
|
Development of Methodologies for
Land Degradation Assessment Applied to
Land Use Planning in Thailand |
|
|