| RESULTS |
| Establishing the SIS |
| 1.Topographic map : |
| The original Topographic map was scanned and rectified using a second order polynomial model, which was selected to fix the probable distortion and inaccuracy, associated with scanning and previous rectification processes. Five tie points (from the grid which appeared on top of the map) were selected to establish the model with RMSE of the residuals (sigma) = 0.283 pixels. The points were distributed throughout the map homogenously, projected using UTM projection with Datum: Indian 1975 Zone 47. Finally the image was resampled to reorient the pixels to the north with six-meter pixel size. |
| 2.Contour map : |
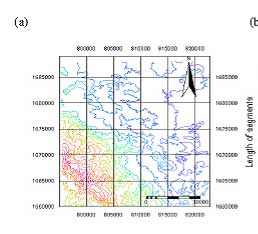
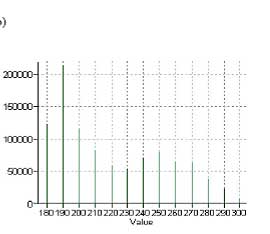
| Contour lines were digitised from the topographic map (1:50000) using the screen digitising facility of ILWIS. The contour interval is ten meter, with minimum elevation of 180 and maximum of 300 meter above sea level. The contour histogram showing one mode at elevation 190m, which indicates the domination of the flat topography (Valley landscape) specially in the north-east region, and the other mode at 250m, which indicates the undulating land of the (dissected Peneplain landscape) |
| 3.DTM : |
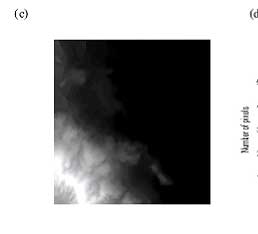
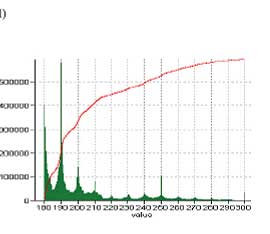
| Because of the flat topography of the area (refer to the histogram) contour lines were chosen as the source of elevation data for the DTM. The DTM is dominated by flat landscape (74.97 % of the elevation values in the DTM below 220m). No auxiliary data (spot heights) were added since the possibility of generating artefacts is very limited, even a few artefacts had been generated in the north-west part, due to the uncompleted contour line, whichever does not affect the study area. A comparison between the histogram of the contour line, and the histogram of the DTM reveals that the interpolated values is skewed towards the right (low elevation), which means also that they are spatially well distributed over the area. |
| 4.TM image : |
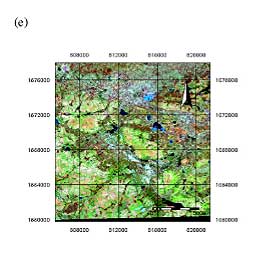
| The satellite image was rectified by the LDD office (Bangkok), colour composite with band combination (7,4,2), and was selected to help in discriminating different land cover types when doing supervised classification. |
| 5.Land cover map : |
| Landsat image was classified using a trained maximum likehood classification algorithm. The threshold distance was set to 80 %. A point coverage that represents the collected ground truth data (collected during the fieldwork) was used to train the classifier for five classes (water, Salt spots, Vegetation, Soil, and Urban) |
|
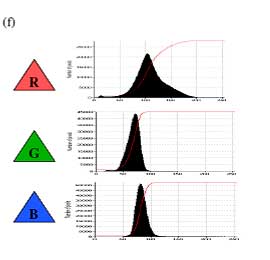
Figure 1 : shows (a) Contour lines vector map, (b) Total length of each elevation isoline, (c) DTM as generated from the contour layer, (d) DTM histogram, (e) Landsat (Feb.2003) satellite image with color composite RGB: 7,4,2 (f) Frequency histogram of the three bands as indicated in the image color
composite. |
|
| PLOT RESULTS |
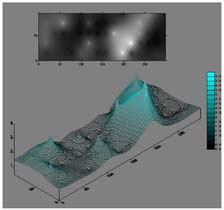 |
| Figure 2 : Interpolation of surface salinity: top panel shows salinity in 2D and bottom panel shows ECe prediction in perspective view |
|
|
In the case study of Aiman (2005), two experimental plots, each of three hectares, were selected in the Nong Suang area in Nakhon Ratchasima province, Northeastern Thailand. The first plot represents the alluvial clayey soils, in the north of the study area, while the second one represents the dominant sandy soils of the area. EM survey was carried out in grids of 2* 5 m. At each site (clayey and sandy) EM data were collected in both horizontal and vertical modes. Soil samples were collected in grids of 20 x 20 m and sent to the laboratory in LDD, the branch of Kon Khen to measure ECe. The latter grid (area) overlaps with the EM grids in 75 locations. This was planned to help measure the accuracy of regression models to predict soil ECe from the EM data, which is yielded having applied Regression Kriging |
| |
|
| |
References |
| |
|
| |
 Soliman A., Detecting salinity in early stages using electromagnetic survey and multivariate geostatistical technique; a Case study of Nong Suang district, Nakhon Ratchasima, Thailand., in Geo-information Science and Earth Observation, Soil Information Systems for Sustainable Land Management. 2004, ITC: Enschede. p. 100. Soliman A., Detecting salinity in early stages using electromagnetic survey and multivariate geostatistical technique; a Case study of Nong Suang district, Nakhon Ratchasima, Thailand., in Geo-information Science and Earth Observation, Soil Information Systems for Sustainable Land Management. 2004, ITC: Enschede. p. 100.
|
|
|
|
|
Development of Methodologies for
Land Degradation Assessment Applied to
Land Use Planning in Thailand |
|
|