| 10 YEARS RETURN PERIOD |
| The results of the model simulation for a storm with a 10 year return period revealed that the flood inundation covers 44% of the area, the average of maximum water depth was 1.25 meters but at some places a maximum depth of 2.96 was reached under present situation. In scenario-A, the downstream floodplain was inundated with average water height of 0.06 meter. The total of 2.28?106 m3 water was stored in the flooded area in scenario-A, which is decreased to 58% from the present situation. In case of scenario-B and scenario-C, the total of flood water volume increased 2 times. The flood extent increased to 29% and 33% in scenarios B and C respectively as compared to present situation. |
| Figure 1 shows the spatial distribution of flood extent in various scenarios: present land use, scenarios A, B and C. The flood water inundated 28%, 57%, 59% of the territory in scenario-A, scenario-B and scenario-C respectively, compared to 44% in the present land cover scenario. The flood area and water depth were larger at the lower part of floodplain due to low position. The maximum water depth of scenario-B and scenario-C higher than 1 meter covers 25% and 28% of flooded area . In scenario-A, the maximum depth of the flood water was lower than 50 centimeters and covers 44% of the flooded area at lower part. |
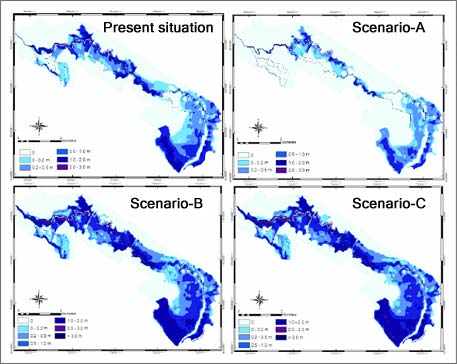 |
Figure 1 : The spatial distribution of maximum water depth of the three scenarios
and present land use with 10 years return period.
|
|
| Figure 2 shows the distribution of the flow velocity for scenarios A, B and C. For most of inundated area the flow velocity does not rise above 0.30 m/s. For only 13% of flooded area, the speed of the water was higher than 30 centimeters per second. In scenario-B and scenario-C, the speed of the water flow is lower than 0.50 m/s but higher than 0.30 m/s covers 8% and 10% of flooded area, respectively . The high flow velocities are found near the apex of the stream, where the channel has the steepest gradient (see figure 2). |
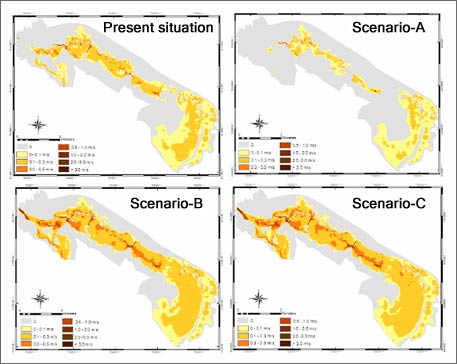 |
Figure 2 : The spatial distribution of maximum flow velocity of the three scenarios
and present land use with 10 years return period.
|
|
|
|
Development of Methodologies for
Land Degradation Assessment Applied to
Land Use Planning in Thailand |
|
|


