| LANDSLIDE INVENTORY MAPPING |
| A Landslide inventory is a type of map which shows the locations and outlines of landslides. It is a data set that may present a single event, a regional event, or multiple events. Small-scale maps may show only landslide locations whereas large-scale maps may distinguish landslide sources from deposits and classify different kinds of landslides and show other pertinent data. |
| Generation of Epipolar Stereo pairs |
To generate an Epipolar stereo pair, the aerial photos of Ang Khang were scanned and imported into ILWIS. Out of the scanned photos five were selected for on screen digitizing and mapping of the landslides. The scanned aerial photos had to be rotated 270 degrees clockwise (using the ILWIS mirror rotate function) for stereoscopic view.
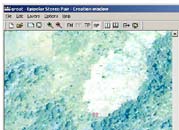
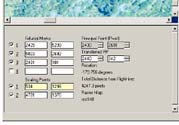
An epipolar creation window (Figure 1) was opened in ILWIS and the input (rotated scanned photo) left and right (rotated mosaic) candidates selected, the right candidate having a georeference system. The three fiducial marks (FM) on the left photo were marked and the principal point (PP) was automatically calculated. This PP was transferred onto the right candidate (mosaic). The mosaic did not have fiducial marks. So, using the paper prints of the scanned aerial photos, 2 lines, (one running from top to bottom and the other from left to right), were drawn and their point of intersection determined. The determined point corresponded to the PP of the mosaic. The PP was manually added onto the mosaic and then transferred to the left candidate. |
|
|
| Figure 1 : Epipolar creation window in ILWIS (indicating FM, PP, TP, SP) |
|
|
| The PP is only an approximation of the best possible rotation point or pivot. Theoretically, the nadir point (i.e. the terrain point perpendicular under the camera) is the point around which the photos should be rotated to make the photos Epipolar to each other. The FM, PP and the PP, two Scaling Points SP were marked on both the left and then the right scanned photos. The same procedure was repeated for the rest of the photos. |
| Generation of the Landslide inventory |
 |
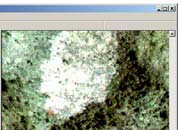
| Figure 2 : Landslide Inventory for Ang Khang (aerial photo interpretation 2002) |
|
The Epipolar pairs were opened one at a time and the pane with the georeferenced mate (the mosaic) was activated. Using the screen scope, the areas with landslide activity were digitised and a segment map produced. With the segment editor, the segments were then checked for self overlaps, dead ends, code consistency and intersection. Once these were all completed, the segment map was polygonised by labelling the points. Using the raster operation, the polygon map was then rasterised and a layout produced indicating the spatial distribution and landslide activity in Ang Khang (Figure 2). |
|
| Results and Discussions |
| Although the Lithology in Ang Khang includes Limestone, Sandstone and Shale, Shale was the most affected by slides occur only in Shale. The soil types ranging from clay and clay gravely loam on the mid slopes are predominant in these areas which were most affected by the slides. The slopes most affected have a slope percentage of 20% and more. A further confirmation of the type of landslides, apart from field observations, involves the use of depth and length. A ratio of depth and length gives a range which can be used to determine whether landslides under investigation are translational or rotational slides. Translational slides in soils usually have a depth to length ratio below 0.1 (Depth of surface of rupture /Length of surface of rupture: D/L) and usually rotational slides have a D/L ratio between 0.15 and 0.33 (Cruden and Varnes 1996). The slides in Ang Khang have a D/L ratio ranging from 0.21 to 0.67 which confirms the fact that most of the observed landslides are rotational slides. |
| Simple calculations indicate that about 81% of the field observations could be mapped. In addition to the 27 mapped field slides, 91 more slides were mapped from the aerial photographs. The difference between what could be mapped and could not be mapped (from the field observations) plus the extra slide, is quiet understandable since the aerial photos were taken in January 2002 and the field work was carried out in September to October 2005. Based on the results of mapping landslides using aerial photo interpretation in Ang Khang, the same interpretation techniques were employed in Wang Chin to map the landslides. |
| Aerial photos, as remote sensing tools, are useful for mapping landslides and production of a landslide inventory for an area under study. Because of the third dimension (Elevation) available due to stereoscopic vision, it was possible to identify the type of landslide activity in Ang Khang. |
| The type of landslides which occur in Ang Khang were not only identified but also mapped. Ang Khang is predominantly affected by rotational slides (slumps) which are small and shallow. Although there is no historical data to indicate for how long this area has been affected by landslides.The landslides in this study area include active, dormant and stable and the Eastern part was more affected by the landslides than the western part. The Eastern part of the area is dominated by shale which is prone to landslides. |
| References |
 Cruden, D. M. and D. J. Varnes (1996). Landslide types and Processes. Landslides: Investigation and Mitigation. A. K. Turner and R. L. Schuster. Washington, D.C, Transportation Research Board National Research Council. Special Report 247: 36 - 75. Cruden, D. M. and D. J. Varnes (1996). Landslide types and Processes. Landslides: Investigation and Mitigation. A. K. Turner and R. L. Schuster. Washington, D.C, Transportation Research Board National Research Council. Special Report 247: 36 - 75. |
|