| LANDSLIDE HAZARD ASSESSMENT |
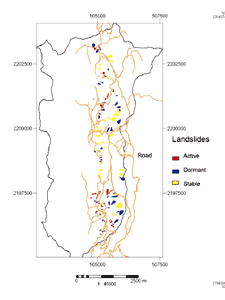
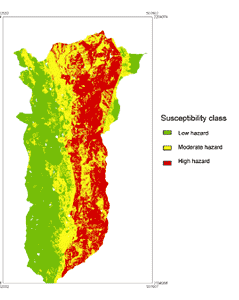
| Landslide hazard study was carried out in Wang Chin, Phrae province and Doi Angkhan, Chiang Mai province. So far only one student opted for landslide hazard study. For landslide mapping, (Namuwaya, 2006) used ortho-photos, image classification of ASTER data, and applied model to assess hazard. The result is shown in figure 8. For modeling landslides, various methods can be applied but weights of evidence approach seems to be more applicable. It is a quantitative method which combines evidence in support of a hypothesis. The step-by-step approach, or factor analysis, used to prepare a landslide hazard map is described below (van Westen et al., 2003): |
| |
| Step1: Calculating prior probability |
| An attribute map indicating only the active landslides was created from the landslide inventory. Then the prior probability was that a certain pixel in the activity map will have a landslide was calculated. It is the density of landslides in the entire area as expressed in equation. |
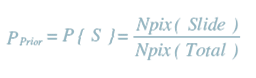 |
Where:
Pprior = P {S} is the Conditional probability of having a landslide S
Npix (Slide) is the number of pixels with landslides in the map
Npix (Total) is the Total number of pixels in the map |
|
| Figure 1 : Landslide mapping and susceptibility assessment in Doi Angkhan area (Namuwaya, 2006) |
|
| |
| Step 2: Calculating conditional probability |
| After calculating the prior probability, the conditional probability was calculated. The probability that landslide could occur is referred to as conditional if we were on “Clay Loam” soils, the probability of the occurrence of the landslide is larger than when we are on “Gravely Loam” soils. |
| The conditional probability of having landslides in Ang Khang, given that one is in a certain unit, is the density of the landslides in the unit. It’s calculated as the number of pixels with the landslides in the unit divided by the total number of pixels in the unit as expressed as equation. |
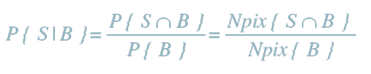 |
Where:
P{S | B } is the conditional probability of having a landslide(S)
while in a certain unit B |
| |
| Step 3: Calculating Positive and Negative Weights |
| Weights of evidence modelling was selected for the indirect landslide susceptibility mapping and it requires that positive (Wi +) and negative (Wi - ) weights to be calculated. These values are assigned to each pixel in each of the factor maps and are defined as: |
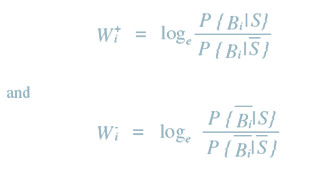 |
where,
Bi = presence of a potential landslide conditioning factor,
Bi = absence of a potential landslide conditioning factor,
S = presence of a landslide, and
S = absence of a landslide |
| The method was performed using the individual factor maps each factor map had a range of classes indicating the conditions present in the study area. For example the Land cover factor map had 8 classes indicating eight categories of land cover representing the area. |
| For each factor, Wi+ was used to indicate the importance of the presence of the factor, for example Clay Soils, for the occurrence of landslides. If Wi+ was positive the presence of the factor is favourable for the occurrence of landslides, and if Wi+ is negative it is not favourable. |
| Wi- was used to evaluate the importance of the absence of the factor for the occurrence of landslides. When Wi- is positive the absence of the factor is favourable for the occurrence of landslides, and when it is not. Weights with extreme values indicate that the factor is a useful for the susceptibility mapping, while factors with a weight around zero have no relation with the occurrence of landslides. |
| The positive and the negative weights expressed in Equations 7.3 and 7.4 were simplified and expressed in terms of the number of pixels and are thus re-written in equations as follows: |
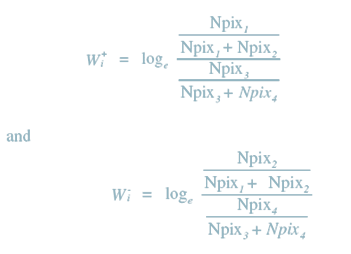 |
Where:
Npix1 = nslclass
Npix2 =nslide – nslclass
Npix3 =nclass – nslclass
Npix4 =nmap – nslide – nclass + nslclass |
And
Nmap = column with the total number of pixels in the map
Nslide = column with the number of slides with landslides in the map
Nclass = column with the number of pixels in the class |
| Because of the nature of the process of weights of evidence modelling (long and time consuming if carried out manually), all the steps described above were incorporated into a weight script which was run to produce the negative and positive weights for each of the factor maps. |