| LISEM |
| The LISEM erosion model structure |
| The LISEM is a physically based hydrological and soil erosion model for simulating the hydrology and sediment transport during and immediately after a single rainfall event applied in agricultural catchment of a size ranging from 1 ha up to approximately 100 km2 (De Roo et al., 1996). The model has been developed by Utrecht University, Department of Physical Geography, the Netherlands. |
| LISEM is built to simulate both the effects of the current land use and the effects of soil conservation measures. Basic processes in LISEM can be divided into two parts which include a water part and an erosion part . The processes incorporated in the model are rainfall, interception, surface storage in micro-depressions, infiltration, vertical movement of water in soil, overland flow, channel flow, detachment by rainfall direct throughfall, transport capacity of the flow and detachment by overland flow. The model also incorporate the influence of compaction including the influence of tractor wheeling�s, small paved roads, field strips and grassed waterways on the hydrological and soil erosion processes (De Roo and Jetten, 1999). In this study, however only runoff processes are taken into account. |
On the runoff process, rainfall is the basic input of the water part. Interception by crops and vegetation is simulated by regarding as a simple storage then subtracted from the rainfall. The remaining rainfall reaches the soil surface, where it can infiltrate or form a surface storage. Since LISEM is a stormbased model the infiltrated water is essentially a loss of water in the sense that infiltrated water cannot resurface. Infiltration can be simulated using one of several available equations such as the Green&Ampt and Holtan equations as well as the physically based Richards equation using the SWATRE sub model. In this study, Green and Ampt infiltration model are used. Surface storage will result in surface runoff once a certain threshold is exceeded. Flow velocity is calculated with the Manning equation and surface runoff is routed over the landscape with the kinematic wave equation. Overland flow can flow into the channel and is then routed to the catchment outlet as channel flow. For overland flow and channel flow are both routed with the kinematic wave, which is solved by a four-point finite difference solution and used together with Manning�s equation. The kinematic wave is done over the Local Drain Directions that forms a network which connects cells in 8 directions (Jetten, 2002).
|
|
 |
| Figure 1 : Simplified flow chart of the LISEM model (Hessel, 2002). |
|
|
| LISEM input maps |
| Since LISEM is process based it requires a significant amount of input data as described by Jetten (2002). All the required input maps were derived from three basic maps which included the digital elevation model, soil unit map and land use map. Soil map which was based on geopedological approach was derived from previous study (Solomon, 2005). This map provided the basis for deriving soil parameters for all the models . A digital land cover map of the study area produced in 2004 by the Land Development Department of Thailand was used for this study . The accuracy of the map was assessed by making use of ground truth samples that were collected during the fieldwork. The overall accuracy of the map was 72% which was considered to be satisfactory for the purpose of this study. The digital elevation model (DEM) was derived using ILWIS version 3.3 by interpolating contours with 10 meters intervals. Grid size of 30 meters was chosen for the resulting map. |
|
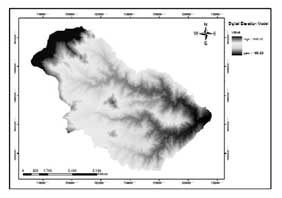 |
| Figure 2 : Digital Elevation Model (DEM) used in LISEM model. |
|
|
| As LISEM is grid-based, all input maps used in the model were converted into raster format having grid size of 30m by 30m. This resolution was selected to coincide with the spatial resolution of the input maps (land-use/cover, soil map and DEM). The choice of time step length used for model depend on the grid size, where smaller cell sizes require small time steps (Hessel, 2005). Thus, time step length of 60 seconds was used to ensures that the time step of the model is less than the time for a wave to travel the distance of a pixel (Chow et al., 1988). |
| Since, LISEM is largely built in a mixture of PCRaster commands and C++ and PCRaster capabilities are used to create the input maps. Thus, a large number of input maps for different parameters are usually generated by using lookup table that assign parameter values for the different units on the land use map or soil map using the PCRaster script file |
| Model Parameters |
| It is not possible to have all the parameters due to lack of time and resources. Some of the parameter values used in the model was derived from literature values and using information on the soil and land cover characteristics of the watershed. To quantify rate of runoff on the catchment, five types of parameters are involved in the water part of the LISEM model. |
1.Catchment characteristics parameter
|
| The parameters required for catchment characteristics are slope gradient, local drainage direction, catchment boundary and location of outlet which were derived from digital elevation map. Rainfall data was obtained from the Royal Irrigation Department, which records the data automatically on hourly basis using a rain gauge installed in the catchment. Rainfall data was considered to be homogeneous over the catchment. |
| 2.Vegetation parameter |
| The parameters required for modelling interception are the percentage canopy cover (PER.map), crop height (CH.map) and leaf area index (LAI.map). Values for fraction canopy cover and vegetation height were estimated in the field. Leaf area index was calculated from the fraction of canopy cover. The land cover map was used for this purpose. For each class of land cover map a representative fraction of canopy cover and crop height values was estimated as indicated in table below. This information was entered into PCRaster table format. |
| Land cover |
Fraction of canopy cover |
Vegetation height (m) |
| Cornfield |
0.60 |
1.84 |
| DegradedForest |
0.70 |
10.00 |
| Forest |
0.80 |
17.51 |
| Orchard |
0.20 |
7.09 |
| Grassland |
0.90 |
1.03 |
| MixedCrop |
0.40 |
0.50 |
|
| 3.Green and Ampt infiltration parameters |
| The parameters required for running the Green and Ampt infiltration were the hydraulic conductivity (ksat1.map), soil water tension at wetting front (PSI1.map), initial soil moisture content (THETAI1.map) and saturated soil moisture content (THETAS1.map). The required values were measured during the fieldwork (see section 5.1) with the exception of values for soil water tension which was obtained from the EROSEM documentation and user guide (Morgan et al., 1998b) for different soil textural classes |
| 4.Soil surface parameter |
| The random roughness of soil surface (RR.map), Manning�s coefficient (N.map) and width of impermeable road (ROADWIDTH.map) were used in this parameter to determine several processes including infiltration, surface storage and velocity of overland flow. In this catchment these maps are based on the land use types. The values of random roughness were derived from the RUSLE handbook documentation (Renard et al., 2000) which is based on the type of tillage practices implemented in agricultural areas were used to estimated surface storage process. Manning�s coefficient is based on land cover types found in the study area which was retrieved from the literature , these considered as surface flow resistance (Chow, 1959). The road width considered as impermeable which no infiltration. The random roughness values used for different land cover classes are shown in table below. |
| Land cover |
Fraction of canopy cover |
| Cornfield |
1.80 |
| DegradedForest |
0.50 |
| Forest |
0.50 |
| Orchard |
0.50 |
| Grassland |
0.50 |
| MixedCrop |
1.80 |
|
| 5.Overland flow and channel flow parameter |
| The kinematic wave model was used to route the excess water and also in channel flow. In LISEM simulation can also be done considering a concentrated flow line, such as a thalweg, to be a channel. All parameters for channel flow were created from channel mask map. The channel mask was created from local drainage direction using the PCRaster operation accuflux which is based on contributing. |
|
| References |
 Chow, V.T., 1959. Open Channel Hydraulics. McGraw-Hill, New York. Chow, V.T., 1959. Open Channel Hydraulics. McGraw-Hill, New York. |
| Chow, V.T., Maidment, D.R. and Mays, L.W., 1988. Applied hydrology. (McGraw-Hill Series in Water Resources and Environmental Engineering). McGraw-Hill, New York etc., 572 pp. |
De Roo, A.P.J. and Jetten, V.G., 1999. Calibrating and validating the LISEM model for two data sets from the Netherlands and South Africa. CATENA, 37(3-4): 477-493.
http://www.sciencedirect.com/science/article/B6VCG-3Y51V0XH/2/c047330928040c19a8cd581e7540192b |
De Roo, A.P.J., Wesseling, C.G. and Ritsema, C.J., 1996. LISEM: A SINGLE-EVENT PHYSICALLY BASED HYDROLOGICAL AND SOIL EROSION MODEL FOR DRAINAGE BASINS. I: THEORY, INPUT AND OUTPUT. Hydrological Processes, 10(8): 1107-1117.
http://dx.doi.org/10.1002/(SICI)1099-1085(199608)10:8<1107::AIDHYP415> 3.0.CO;2-4 |
Hessel, R., 2005. Effects of grid cell size and time step length on simulation results of The Limburg soil erosion model (LISEM). Hydrological Processes, 19(15): 3037-3049.
http://dx.doi.org/10.1002/hyp.5815 |
| Jetten, V.G., 2002. LISEM : Limburg Soil Erosion Model User Manual Window version 2.x, Utrecht Center for Environmant and Landscape Dynamics, Utrecht. |
Morgan, R.P.C. et al., 1998b. The European Soil Erosion Model (EUROSEM): documentation and user guide, Cranfield University, Silsoe, Bedford.
http://www.silsoe.cranfield.ac.uk/nsri/research/erosion/user_v2.pdf |
| Renard, K.G., Foster, G.R., Weesies, G.A., McCool, D.K. and Yoder, D.C., 2000. Predicting Soil Erosion by Water: A Guide to Conservation Planning with the Revised Universal Soil Loss Equation (RUSLE). The U.S. Department of Agriculture (USDA), Washington, DC, 407 pp. |
Solomon, H., 2005. GIS based surface runoff modeling and analysis of contributing factors : a case study of Nam Chun watershed, Thailand, International Institute for Geo-information Science and Earth Observation, Enschede, the Netherland, 99 pp.
http://www.itc.nl/library/Papers_2005/msc/ereg/harssema.pdf |
|
|
|
Development of Methodologies for
Land Degradation Assessment Applied to
Land Use Planning in Thailand |
|
|


