GEOMORPHOLOGY
|
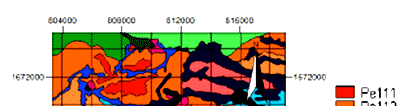
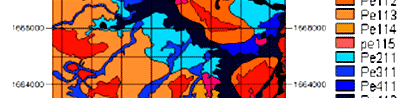
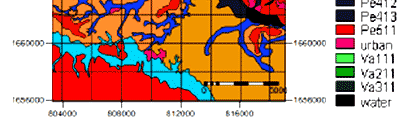
| Geomorphology was studied by Aerial photo interpretation (API): The photo set contains eight aerial photographs, which cover approximately 300 Km2 (30,000 ha). The photos were organized in two photo-runs, and formulated six stereo-pairs were interpreted. The result shows that there are two major Landscapes namely: Valley, and Peneplain. Ten relief types, two lithological units (making use of the geological map and reliable literature), and finally fourteen landforms were distinguished (see figure 1). Statistics reveals that there are 77 delineations (at the level of landform). The minimum delineation is approximately six hectares, while the maximum size is approximately 3800 hectares. The interpretation was done over four transparencies, and joined manually using the ‘lighting table’. Table (1) shows the description of the geopedologic units and the hierarchal classification associated with them |
|
| Figure 1 : Geopedological map |
|
| Relief Type |
LIthology |
Landform |
GP Code |
| Ridge |
Sedimentary rocks Korat Group |
Top complex |
Pe111 |
| Side complex |
Pe112 |
| Slope-facet complex |
Pe113 |
| Summit |
Pe114 |
| Tread riser complex |
Pe115 |
| Glacis |
Sedimentary rocks Korat Group |
Tread riser complex |
Pe211 |
| Vale |
Sedimentary rocks Korat Group |
Slope complex |
Pe311 |
| Lateral Vale |
Sedimentary rocks Korat Group |
Side complex |
Pe411 |
| Bottom-Side complex |
Pe412 |
| Bottom complex |
Pe413 |
| Depression |
Sedimentary rocks Korat Group |
Basin |
Pe511 |
| Food plain |
Alluvial deposits |
Levee-overflow complex |
Va111 |
| Old Terraces |
Alluvial deposits |
Overflow-Basin complex |
Va211 |
| New Terraces |
Alluvial deposits |
Overflow-Basin complex |
Va311 |
|
| Landcover |
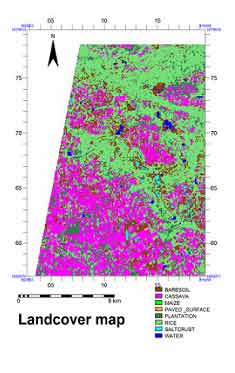
| The Land cover of Korat plateau was subject to a number of changes. The native Landcover in the area is ‘Dipterocarps’ forest. A major part of it has been changed to agriculture land and paddy fields as a consequence of the agriculture development, which begin in the sixties. Yamamoto et al. mentioned that the maize and kenaf was introduced to the local farmers in the 1960’s, the Cassava in the 1970’s,and then sugarcane in the 1980’s, while the dominant crops at the time of the fieldwork was the cassava, and sugarcane. |
| The classified map clearly shows the pattern of crop growing areas. Light green areas are classified as rice, which is lowland where rice is grown. The extent of maize growing areas is less and not corresponding with ground truthing. The area at the time of ground truthing was maize might be covered by cassava in the image (accuracy percentage is 69% as observed from a confusion matrix). Since ground truthing time and the period the image was shortly differ, it is possible that landuse in a shifting cultivating system might have shifted from maize growing to cassava growing during the time of field work (see figure 2). |
|
|
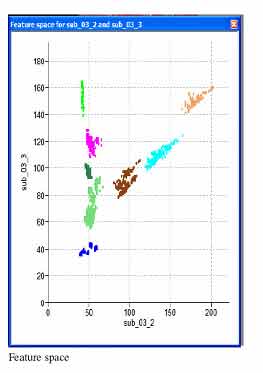
| Figure 2 : Landuse/cover map and feature space |
|
| References |
 LDD, Excursion program for the international symposium on paddy soils. 1996, LDD: Khon Kaen. LDD, Excursion program for the international symposium on paddy soils. 1996, LDD: Khon Kaen. |
| Imaizumi, K., Sukchan, S., Wichaidit, P., Srisuk, K., and Kaneko,F., Hydrological and Geochemical behavior of saline groundwater im phra yun, northeast Thailand. 2002, LDD: Khon Kaen. p. 7-14. |
| Pramojanee, P., A study of the relationship between salt affected soils and landforms in Amphoe Kam Sakae Saeng area, Nahkon Ratchasima province, Thailand, in soil science division. 1982, ITC: Enschede. p. 155. |
|
|
|
Development of Methodologies for
Land Degradation Assessment Applied to
Land Use Planning in Thailand |
|
|