The main objective of this study is to assess erosion prone areas in inaccessible mountain areas by applying image processing and digital terrain analysis techniques. The topographic removal techniques were implemented to improve spectral reflectance of Landsat satellite images obtained in 1988, 2000 and 2007. Image classification was applied to generate land use/cover map. Trend of land use/cover change was also investigated to know the conversion between land use/cover classes in those periods. For assessing soil erosion, the erosion model played important role. An assessment of the relationship between NDVI and C-factor was done to see whether NDVI could be used as estimator of C-factor in the study area or not. Land use/cover map 2007 was used to predict soil loss rate and classified erosion prone areas. It was also used to analysis bulk density and soil organic matter distribution pattern in different land use/cover classes. The results of analysis together with trend of land use/cover change are reflected in soil erosion. Digital terrain analysis was carried out to define critical zones for gully formation which was then compared with the erosion prone areas for confirmation. In this chapter, results are summarized and discussed as follows:
Land use classification
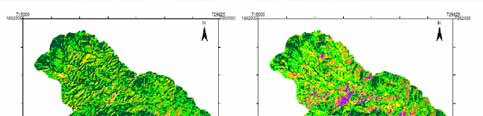
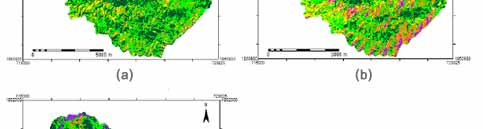
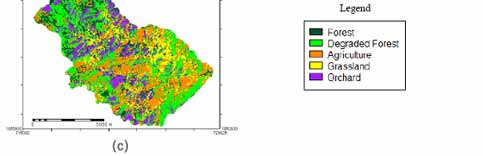
Land use/cover classification of 1988, 2000 and 2007 were done by using supervised classification with the maximum likelihood algorithm in ERDAS 9.1 software. Training samples were separated from validated data. The land use/cover maps were classified in five classes including forest, degraded forest, agriculture, grassland and orchard with total areas 6,658 hectares. In Figure 1 (a), (b) and (c) showed land use/cover classification maps in periods of 1988, 2000 and 2007 respectively. The comparison of the different land use/cover between those periods is shown in Table 1 as follows.
Figure 1 : Land use/cover classification maps; (a) 1988, (b) 2000 and (c) 2007
Table 1 : Comparison the areas of land use/cover in 1988, 2000 and 2007
Land use/cover class
Area in 1988
Area in 2000
Area in 2007
hectares
percent
hectares
percent
hectares
percent
Forest
2699
40.54
2411
21.20
857
12.87
Degraded Forest
2663
40.00
2551
38.33
2267
34.04
Agricultrure
740
11.11
1107
16.62
1686
25.32
Grassland
496
7.45
1081
16.23
778
11.70
Orchard
60
0.90
508
7.62
1070
16.07
Total
6658
100
6658
100
6658
100
Trend of land use/cover change from 1988 to 2007
From the results of classification in the periods 1988 to 2007, forest and degrades forest areas were decreasing especially forest areas loss around 1,842 hectares from 2,699 hectares within 19 years. Degraded forest areas also decreased from 2,663 hectares to 2,267 hectares. Conversely, in agriculture areas and orchard that increased 946 and 1,010 hectares respectively. These were an evident that deforestation had occurred in this area. Most of the area has rugged terrains that mean the deforestation also occurred on hill slope areas, which was replaced by agriculture. This led to soil erosion problem and severe disaster that caused heavy landslide and flooding in 2001. During field work it was observed that, orchard and agriculture areas were on the mountain slopes. Although the government policy is a forestation on sloping land but it lacked of realistic implementation and responsibility of the villagers and officers. Also the forest areas from plantation project were not permanent. Teak plantation has the objective for commercial reason; they will be cut down again when they grow up. The change of land use/cover areas in periods 1988, 2000 and 2007 is shown in the Table 2 below:
Table 2 : Land use/cover change in the periods 1988 - 2007
Land use class
1988 Area in hectares
2000 Area in hectares
2007 Area in hectares
Change area from 1988 to 2007 in hectares
Change from the total area (%)
Forest
2699
2411
857
-1842
-27.67
Degraded Forest
2663
2551
2267
-396
-5.95
Agricultrure
740
1107
1686
946
14.21
Grassland
496
1081
778
282
4.24
Orchard
60
508
1070
1010
15.17
Total
6658
6658
6658
Development of Methodologies for
Land Degradation Assessment Applied to
Land Use Planning in Thailand