| SOIL SALINITY STUDY |
Detecting and mapping salinity has been study subject for many researches, but none of the proposed techniques is declared to detect the degradation at its early stage. Next to the advantages, the limitations of the conventional Satellite remote sensing and, since over a decade already, the use of geostatistics in mapping salt-affected soils have been documented by many researchers. Remote sensing which is a relatively inexpensive detecting technique for small-scale surveys, can see the surface salinity. It is only useful to detect the last stages, when the degradation is already exhibited at the soil surface. Geostatistics, which is a precise way to represent the soil salinity distribution, needs uneconomic number of samples to model the variability.
|
| Geopedology, which can be considered as a science and art of modelling the occurrence of soils in landscape, is vital not only in mapping soils but also in their interpretation and the followed up planning for appropriate managements. |
| Salinization is the dynamic process of accumulation of soluble salts in the soils. Soil salinization resulted from geopedologic/hydrologic setting is a widespread environmental problem in many places in (semi-) arid regions of the world. Although identification and large-scale mapping of salt-affected soils are essential, they are not the clue for a sustainable management. To understand the salinization process helps avoid degradation by selecting and applying the most appropriate land management practices (ref. the paper presented in Hin Hua; Understanding geopedologic setting is a clue for improving the management of salt-affected soils in Non Suang district, Nakhon Ratchasima, Thailand). |
| On the basis of a formulated integrated approach, where GIS-based geopedology, near surface geophysics (electromagnetic survey), modelling and multivariate geostatistics form the study components, the two studies (Soliman, 2004; Yadav, 2005) were formulated. In a GIS-based geopedologic survey the Hydropedologic setting becomes clear, which gives way to design the sampling, and the further steps of the research. |
| An electromagnectic device (eg., EM38) measures the ground bulk electrical conductivity or resistivity of the soil by inducting electromagnetic field and measuring the bulk electrical conductivity of the soil material, which is mainly influenced by the particles conductivity (CEC), porosity, moisture content and the salinity of soil solution. The main limitations of the EM survey lie on the reliability of the measurements where variations of soil properties (e.g. soil moisture content and texture) have influenced the readings, and on the devised interpolator for the prediction of salinity at unsampled locations. |
| In the case study of Aiman (2005), two experimental plots, each of three hectares, were selected in the Nong Suang area in Nakhon Ratchasima province, Northeastern Thailand. The first plot represents the alluvial clayey soils, in the north of the study area, while the second one represents the dominant sandy soils of the area. EM survey was carried out in grids of 2* 5 m. At each site (clayey and sandy) EM data were collected in both horizontal and vertical modes. Soil samples were collected in grids of 20 x 20 m and sent to the laboratory in LDD, the branch of Kon Khen to measure ECe. The latter grid (area) overlaps with the EM grids in 75 locations. This was planned to help measure the accuracy of regression models to predict soil ECe from the EM data, which is yielded having applied Regression Kriging . |
|
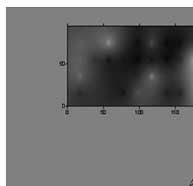
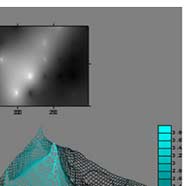
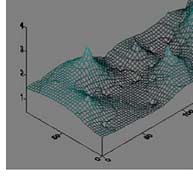
| Figure 1 : Interpolation of surface salinity: top panel shows salinity in 2D
and bottom panel shows ECe prediction in perspective view |
|
|
| In another case study (Yadav, 2005), two crop growth simulation models, the CropSyst (Australian) and the PS123 (Dutch) were applied. Crop yield depends on many factors such as climate, soil, crop, and management. Therefore, a suitable model, which include all these factors need to be applied. CropSyst is the model that considers solute movement on all the stages of growth in yield assessment. The model has been applied on several agricultural practices assessment successfully under different climatic conditions in different parts of the world(Bellocchi G.1, 2002; FAO, 1995; Stockle et al., 2003). |
| The PS123 was also used to simulate growth of crops with associated process that might influence the crop growth such as water (limitation) and solute movements in soil. In other words, the model (a biophysical crop growth simulation) predicts yields under several production levels based on basic plant physiology and soil process. |
|
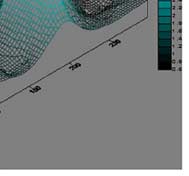
| Figure 2 : Classification of saline soils using image transformation,
DEM and geopedologic interpretation (Shrestha et al., 2005) |
|
Some selected measured soil salinity and fertility variables (EC, pH, CEC and OM) were used to estimate their variation in geopedologic units at “relief type” and at “landscape” levels, and also their spatial variation and dependency to estimate the area affected by salinity. Soil salinity and soil fertility varied significantly within and between geopedologic units at “relief type” and “landscape” levels. Moving average gave best interpolation result in salinity and fertility modelling. PS123 simulates crop yield that correlates significantly with farmers yield. This was not true for the case of CropSyst. Both models simulate crop yield with different degree of salinity (sensitivity analysis).
Now a days, the development of GIS and remote sensing based models are used in various fields of studies. The GIS and remote sensing tools and techniques are commonly applied in natural resources management. These were also applied in order to compare the results obtained from the deterministic models. Result of a case study of applying image transformation by means of band rotation to enhance soil spectral reflectance and combining the result in geopedologic image interpretation is shown in figure 2. |
|
|
|
Development of Methodologies for
Land Degradation Assessment Applied to
Land Use Planning in Thailand |
|
|