| GEOPEDOLOGIC MAP |
| GP map is the basic layer in the �SIS�, which formulates the general framework for the research. It was produced through three main steps |
 Photo interpretation. Photo interpretation.
Digitising analog photo interpretation
Fieldwork |
|
| Aerial photo interpretation (API): |
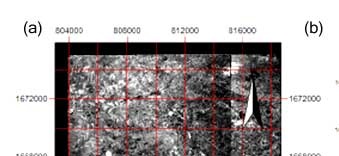
| The photoset contains eight aerial photographs, which cover approximately 300 Km2 (30,000 ha). The photos were organized in two photo-runs, and formulated six stereo-pairs were interpreted according to the �Geopedologic approach�[37]. The result shows that there are two major Landscapes, namely Valley, and Peneplain. Ten relief types, two lithological units (making use of the geological map and reliable literature), and finally fourteen landforms were distinguished. Statistics reveals that there are 77 delineations (at the level of landform). The minimum delineation is approximately six hectares, while the maximum size is approximately 3800 hectares. The interpretation was done over four transparencies, and joined manually using the �lighting table�. |
| Converting API map to digital coverage: |
| The method described by (Rossiter et al., 2002) was followed. The four-centre photos (which represents the stereo-model) were scanned with 300 dpi resolutions, while the overlays were scanned with 150dpi. The orthorectification was done using the existing DTM in the background, and with several common ground control points between the topographic map and the aerial photos. The maximum error was 4.6 pixels (18.4 m) from an orthophoto model with eleven tie points, and the minimum 3.1 pixels (12.4m) from an orthophoto model with eight tie points. This error is considered acceptable, because |
Eight years difference between the aerial photographing date and the date topographic maps were produced (Topo maps were produced in year 1991, while the aerial photos were taken in 1999)
The difficulty of defining the common tie points in the study area. (a flat topography without sufficient infrastructure, the major use cover is cassava or paddy fields)
Final scale of the GP map (1:50,000). |
|
| The aerial photos were resampled to a grid with four-meters pixel size. After Orthorectifying the four aerial photos the rectification accuracy was checked by overlaying the streams and roads layer (generated from the topographic map), and relatively stable landmarks (even though there are some evidences that they have changed in a few locations) to enhance the distribution of the tie points (by adding more) to achieve homogenous accuracy all over the photos. The overlays were georeferanced using an Affine transformation to fix rotation and scale distortion. The maximum error was 1.8 pixels, and the minimum of 0.5 pixels with six tie points. The rectified interpretation layer was then scanned and digitised, using the on-screen digitising facility of ILWIS. The overlays were resampled to a grid with 8.5 m pixel size. Finally the vector layer was checked for topological errors, and turned to polygon coverage by labeling the polygon using GP classification with last four hierarchal levels to enable reclassifying the GP layer at any of those levels. |
| The generated DTM was used to check the plausibility of the GP units, and the result shows high compatibility between the GP units and the DTM especially in the flat region (Northeast part), while the majority of the rectification errors accumulate at the southwest ridge. |
| |
|
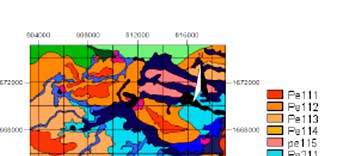
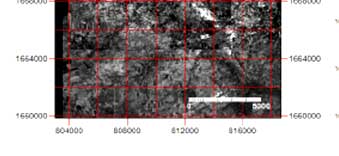
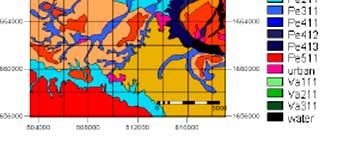
| Figure 1 : (a) Final aerial photo mosaic, (b) GP map at the final hierarchal level (Landform) |
|
| Landscape |
Relief Type |
Lithology |
Landform |
GP Code |
| Peneplain (Pe) |
Ridge |
Sedimentary rocks Korat group |
Top complex |
Pe111 |
| Side complex |
Pe112 |
| Slope-facet complex |
Pe113 |
| Summit |
Pe114 |
| Tread riser complex |
Pe115 |
| Glacis |
Sedimentary rocks Korat group |
Tread riser complex |
Pe211 |
| Vale |
Sedimentary rocks Korat group |
Slope complex |
Pe311 |
| Lateral Vale |
Sedimentary rocks Korat group |
Side complex |
Pe411 |
| Bottom-Side complex |
Pe412 |
| Bottom complex |
Pe413 |
| Depression |
Sedimentary rocks Korat group |
Basin |
Pe511 |
| Valley (Va) |
Flood Plain |
Alluvial deposits |
Levee - Overflow complex |
Va111 |
| Old Terraces |
Alluvial deposits |
Overflow - Basin complex |
Va211 |
| New Terraces |
Alluvial deposits |
Overflow - Basin complex |
Va311 |
|
| References |
| Rossiter, D.G. and T. Hengl (2002). Technical note: Creating geometrically-correct photointerpretations, photomosaics and base maps for a project GIS., ITC: Enschede. |
|
|
|
Development of Methodologies for
Land Degradation Assessment Applied to
Land Use Planning in Thailand |
|
|