| LANDSLIDE MAPPING IN WANG CHIN USING DIGITAL IMAGE ANALYSIS TECHNIQUES. |
| Satellite images offer an efficient and quick data source (of the earth�s surface) to obtain the most recent and the urgently needed topographic or thematic maps. Present technology provides the possibility of accelerating the production of these maps (Sabins 1996). One of the means of extracting data from images is by means of classification. Digital image classification is based on the different spectral characteristics of the earth�s surface which include soil, vegetation, rocks, water bodies, etc (Sabins 1996). During this process, the operator instructs the computer to perform an �interpretation� according to certain conditions, which are specified during the training phase. |
| Satellite Image: ASTER image and its features |
| For digital image analysis, this study used the ASTER image. ASTER is a Japanese and American high performance sensor operated by the Japanese Ministry of Economy, Trade and Industry. The term ASTER stands for Advanced Spaceborne Thermal Emission and Reflection Radiometer. The features of the ASTER sensor are: |
 Wide spectrum of wavelength (VNIR 3 bands, SWIR 6 bands, TIR 5 bands) Wide spectrum of wavelength (VNIR 3 bands, SWIR 6 bands, TIR 5 bands)
Stereoscopic data in a single orbit using the near � infrared bands
High geometric and radiometric accuracy
World wide coverage and reasonable prices |
|
| The image processing and classification methods which have been selected for this study include Normalized Difference Vegetation Index, Maximum Likelihood Supervised classification without Intensity Normalisation, Maximum Likelihood Supervised classification with intensity normalisation, Spectral Angle Mapper and incorporation of Slope map and Geology map to improve Maximum Likelihood Classification. |
| Selection of the test area |
| In order to carry out the classification and landslide mapping in particular using the digital analysis techniques, a test area was selected and the results of this area would be extrapolated to the rest of the Wang Chin watershed. |
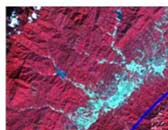
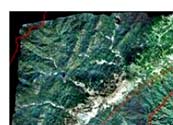
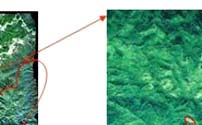
| The selected area in Figure 1 shows the test area used for landslide mapping. The landslides in this watershed seem to be localized in this specific area. Some possible reasons for this are: |
| The differences in the geology of the area are clearly highlighted. The first among these differences is the drainage pattern. The south eastern area has a concentrated drainage network, dendritic in particular. This type of drainage is characteristic of Shale which is characterized by its low resistance to erosion (Way 1973). The Geology map indicates that this area is covered by |
| Shale, Sandstone and Conglomerates. Another observation was the fact that the landslides seem to occur on the face slopes of the ridges. The back slopes appear not to be less prone to landslides. |
|
Figure 1 : A false colour composite showing the test area zoomed
in to indicate location of the landslides (white patches) |
|
| Landslide mapping using Aerial Photo interpretation |
| Aerial photos at a scale of 1:25,000 were supplied by Land Development Department (LDD), Ministry of Agriculture and Cooperatives, Bangkok, Thailand. The aerial photos were scanned and a few were selected to produce an orthophoto. Scanning of aerial photos reduces the differences between them and the satellite images. (Scanning converts the analogue data into digital format but that does not make it similar to satellite image) The scanned photographs were imported into ERDAS Imagine 8.7 as a step towards producing an ortho photo. The ASTER image was used for georeferencing the selected photographs since ground control points from field observations or a base map were not available. The Interior orientation was set using the fiducial marks and camera information, read off the photographs, like focal length and the type of camera. |
| Three runs out of the five runs were selected. This was because from studying the photographs using the stereoscope, these runs appeared to have more landslide activity in comparison to the other runs. In addition to this, since the process of producing an ortho photo is laborious, a decision had to be made to select those photos which would give a better representation of the area in terms of landslide activity. |
| The ortho photo generation was carried out in ERDAS Imagine version 8.7. Using the geo-coded ASTER image as a reference on the left, the first scanned photo was loaded on the right. The scanned photo was rotated 90 degrees anticlockwise, for orientation towards the north. Ground control points were generated in reference to the ASTER image for the first photo. The georeferenced photo was then used as a reference for the next overlapping photo in the run. This process was continued until all the selected photos were georeferenced. |
| Automatic generation of tie points produced a root mean square error (RMSE) of 0.115. The swipe tool (in ERDAS 8.7 imagine) was used to check whether the ASTER image and the ortho photo were perfectly overlapping. The result was a perfect overlap of the ortho photo and the ASTER image. Unfortunately the resultant ortho photo had an uneven contrast. |
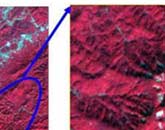
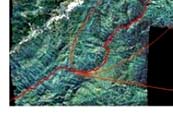
| Feathering was then applied to the ortho photo to improve its contrast especially in the areas of overlap. With feathering, the intensity of one photo decreases as the intensity of the second photo increases over the area of overlap thus evening them out. Not only was the contrast not even, but also the colors within the ortho photo. Therefore image dodging was used to improve on the color contrast throughout the resultant ortho photo shown in Figure 2. |
|
| Figure 2 : Showing the ortho photo of the Wang Chin test area for landslides mapping. |
|
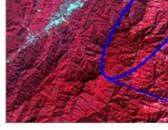
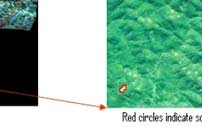
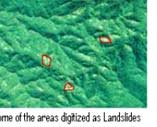
| The resultant Landslide inventory for the Mae Suary sub water shed indicates only the active landslides. No other type of landslides could be recognised during the aerial photo interpretation. Mae Suay sub- watershed is under a dense humid forest whose vegetation covers the landslide scars. The type of landslides identified and mapped in this sub- watershed are small rotational slides. Since there is no historical record of the landslides in this area not much can be side about how frequently they do occur. Figure 3 shows landslide map of the Mae Suay sub-watershed in Wang Chin District. |
|
| Figure 3 : Landslide map of the Mae Suay sub water Shed in Wang Chin District |
|
| References |
| Sabins, F. ( 1996). Remote Sensing:principles and interpretation. New York:, W.H. Freeman and Company. |
| Way, D. G. (1973). Terrain Analysis: A Guide to Site Selection Using Aerial Photographic Interpretation. Stroudsburg,Pennsylvania,USA, Dowden, Hutchinson & Ross, Inc. |
|