| DISCUSSIONS |
| After identifying the Geology of interest and the Slope classes of interest, the unvegetated scarps outside the area of interest were masked out using the two conditions. The results are presented in Table 1 |
| Band Combination |
Geol = "TR3" |
Geol = "TR3" and Slope > 5 |
| 123 (VNIR) |
104428 |
49545 |
| 234 (VNIR + SWIR) |
1031091 |
431361 |
| 731 (VNIR + SWIR) |
168127 |
64478 |
| 123456 (VNIR + SWIR) |
59556 |
23060 |
|
| Although it�s true that the remote sensing tool is useful for landslide hazard mapping, a true picture for the comparison of results obtained from the use of the various techniques (as mentioned above) is only possible if the temporal conditions are similar. |
|
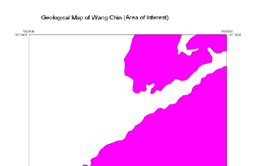
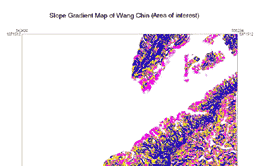
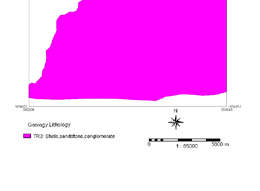
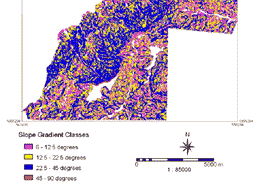
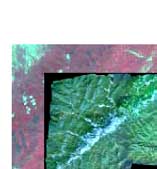
| Figure 1 : Geological map and Slope Gradient map of the area |
|
| Accuracy Assessment |
| In order make an accuracy assessment, the classification results of the various band combinations, after masking out the landslide features using the masks from Geology and Slope gradient, were crossed with the Landslide map produced from aerial photo interpretation. |
|
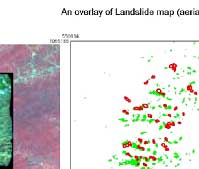
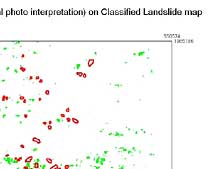
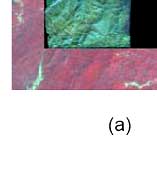
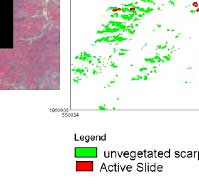
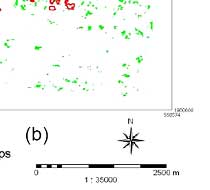
| Figure 2 : Showing an overlay of the ortho photo on the test area of the ASTER image to show that the two did not have a perfect match (a) and (b) showing an overlay of landslide boundaries from aerial photo interpretation on the classification results (bands 2,3 and 4) from digital image analysis. |
|
| Although the overall accuracy was high, it was discovered that the error of omission and commission were equally high. Therefore it was not necessary to test the accuracy of the classification results from the other band combinations. For an accuracy test to be carried out, both the Image and the photo ortho photo should have had a perfect match which was not the case in this study as indicated in Figure 2 (a) and (b). It was not clear what the cause of the shift was. Unfortunately there was not enough time to identify what the cause of problem was and also to rectify it or even to carry out post processing with the other algorithms. |
| It is indicated that the best band combination for mapping landslides using digital image analysis is bands 2,3 (from the VNIR region ) and band 4 from the SWIR region of the spectrum. The rest of the band combinations (7,3,1 and 1,2,3,4,5,6) indicate poor results. |
| Comparison between landslide mapping using aerial photos and digital images |
| A comparison was made between satellite imagery taken in November 2001 to aerial photographs taken in January and December, 2002. Since there were no aerial photographs taken in 2001, it is not possible to make a change detection of the state of slope instability in Wang Chin. The differences between digital images and aerial photographs are summarised in Table 2 |
| Attribute |
Satellite Images - ASTER |
Aerial Photographs |
| Resolution |
15m does not give much detail and small landslides can not be mapped |
2m gives a lot of detail and and small landslides can be mapped |
| Stereo Vision (3D) |
ASTER has an along-track stereoscorpic capability, using a near-infrared spectral band, from which high quality DEM's can be generated for virtually any location on the Earth's surface |
Readily available as long as a stereoscorpic is available |
| Time of acquisition |
Taken in November 2001 (6 months after the rain storm) |
Taken in January and December 2002 - long after the rain strom. |
| Type of Landslides |
their identification not possible |
their identification possible |
| Means of extraction |
Classification and screen digitizing |
Stereoscorpic view and on screen digitizing |
| Cost |
Cheap and have a regular revisit time. |
Can be expensive especially if required on a regular basis at large scale. |
|
| Although the aerial photo interpretation results were basically for testing accuracy, it is very likely that during the generation of the ortho photo there could have been errors as a result of radial distortions which in turn affected the results from the interpretation. On the other hand, errors could have arisen during the interpretation and mapping of the landslides using the aerial photos. Therefore a combination of all these errors greatly reduced the accuracy of the digital image analysis techniques in mapping landslides. |